Having waited for over 2 years for the NZTA’s announcement of the Basin Overpass, it was good to see the scheme given some decent coverage in the DomPost the other weekend. Finally we got to see some graphics on what it may look like – although seeing as this is more or less exactly the same as what was intimated 2 or 3 years ago, you have to wonder what the hell they’ve been doing in the mean time.

It is all part of the Roads of National Significance, otherwise known as the RoNS. That’s such an awkward name, and seeing as Transit (sorry, NZTA) gave us just two options that we’ve seen before – and because this ‘consultation’ all seems so laughable, that I think I shall just refer to those particular options as the Two Ronnies. SO today I thought it might be worth looking at what is behind their costings – how does all this roading get costed? So – from the NZTA archives – here is the bit where they justify the cost of the Ronnies:
Limitations of CGE modelling of roading investment
“The most significant limitation is the quality of the roading project data that is fed into the GE model. The main inputs are nothing other than a subset of the output of traditional partial equilibrium cost-benefit analysis – reductions in work-related travel time, lower vehicle operating costs and reductions in accident-related expenditure. Any error in these estimates will translate directly into comparable error margins on the GE results.Another limitation is that non-market costs and benefits are not captured in GE models. For example, GE models do not generally capture the value of pain and suffering associated with accident trauma, nor the value of savings in travel time where the travel is related to leisure activities….
Travel for commuting is also excluded in our analysis as it is assumed that savings in commuting time would be taken as additional leisure, rather than as more working hours. If this assumption is considered unreasonable it is a straightforward matter to simulate the situation where some or all commuting time substitutes for work time.
Unless information is provided to the contrary – information which does not usually feature in roading cost-benefit analysis – it is assumed that savings in (work) travel time are allocated to industries on the basis of their direct use of petrol and diesel for transport. Firms that do not operate their own vehicle fleet obtain their benefit indirectly through the effects on commercial transport industries. The same procedure applies to vehicle operating costs and legal costs associated with accidents, except that households are also included.
Clearly then the user mix of benefits should be seen as approximate, albeit no more approximate than what is implicit in the usual cost-benefit analysis. In this sense a GE model cannot add empirical content. For most projects this limitation probably has second order effects, but for projects that (are targeted to) benefit particular industries it may be worthwhile to test the robustness of results to alternative assumptions about the incidence of benefits across road users.”
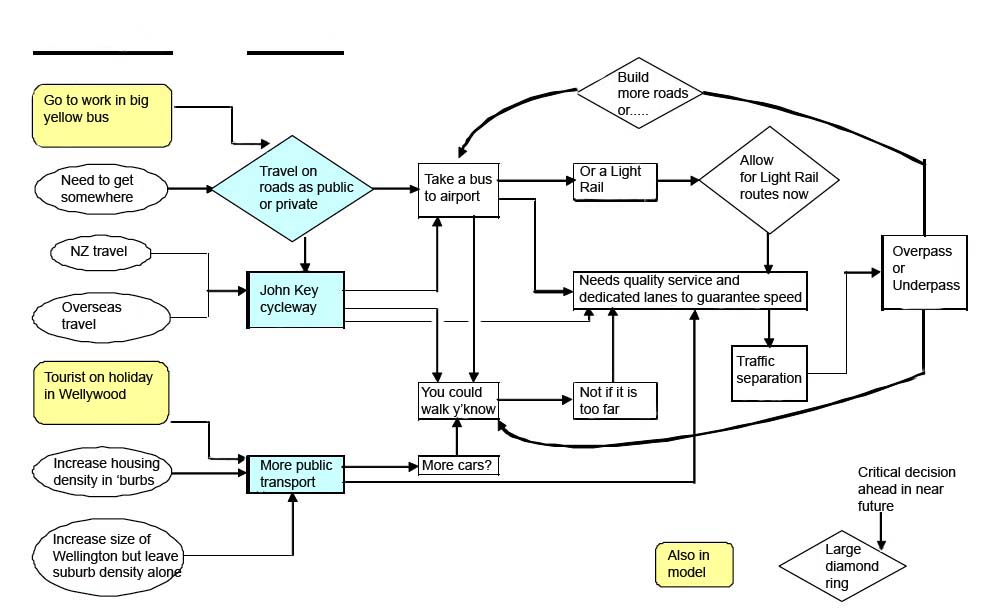
You’ve got all that? In case you missed the salient points: the costing relates only to roads insofar as they relate to work – any savings in time of commuters getting to work are counted, but any savings in time of people getting to weekend footie are ignored. Seeing as people generally tend to go to work in the morning, and go home again in the evening, that means that day time users are predominantly only trucks, vans, taxis, and couriers. Mums taking babies to creche don’t enter into the arguments. Although these marvelous cash-flow diagrams seem to have it all sorted, my feeling is that it shows its all pretty nebulous. So I’ve done my own version (above) where I look at another way of figuring out these costs.
Anyway – back to the analysis! The Summary Report in their Conclusion notes that :
i. Each Road of National Significance (RoNS) has been subject to a conventional economic assessment by NZTA considering traffic benefits, travel time savings, accident reductions, vehicle operating cost savings, and associated benefits and costs;
ii. WEBs have also been identified and quantified at both a regional level and a national level, broadly consistent with the use of WEBs in program evaluation in other countries;
iii. These WEBs are generated by the RoNS program beyond those estimated through conventional economic assessment, and are of relatively considerable scale;
iv. Conventional assessments undertaken for each RoNS assessed at a portfolio level, indicate that the RoNS portfolio generates positive economic benefits with an NPV of over $4.5bn and a BCR of approximately 1.8 (in other words, for every $1 of capital invested, the portfolio generates approximately $1.80 in return);
v. Estimates of regional WEBs and of national economic and productivity benefits indicate that the potential exists for further additional benefits to the economy generated by the RoNS over and above conventional transport economic benefits;
vi. There is not a materially significant difference between the outcomes of implementing the RoNS under an aspirational versus compliant timetable – the inclusion of WEBs does not change this outcome;
vii. Notwithstanding this, the results indicate that the total benefits remain larger than total costs for the RoNS portfolio as a whole, whether delivered as an aspirational program or a compliant program;
viii. The results indicate that there is no major difference in economic outcome in substantially delivering the RoNS within a ten year timeframe (an aspirational scenario) compared to a longer delivery timeframe. Indeed if funds are available to invest sooner, economic benefits generated by the RoNS, both conventional and wider, can be realised sooner.
Now, I’m presuming that a WEB is not something made by a spider, nor SpiderMan, but instead is probably a Wider Economic Benefit. And before I bore you (and myself) to tears over this, I’d say that the whole point of that excerpt was to highlight that (point iv.) the BCR (that’s the Benefit / Cost Ratio) needs to be 1.8 for a project to make economic sense.
As you’ve probably all gathered, the BCR on this project is nowhere near 1.8 and in fact is apparently a lot less than 1 ie there is no economic benefit for doing this work at all. However, given that (as noted above) all the benefits for people not driving trucks or taxis are not taken into account, then actually it shows that perhaps all the cost rationale on this project is based on completely irrelevant information?


Pardon my ignorance Max, I was under the impression that the RONS moniker was brought out because a several of the cost/benefit ratios on these projects fell too low?
When I studied traffic engineering 101 they measured time delays to all users and applied that time lost to the average wage – fairly simple.None of this “going to work or not” malarky
Incidentally we were taught that, in lieu of any better counting measure, road deaths were calculated as being $2 million each, that being a rough approximation of average lifetime earnings.
A dismal science indeed
60 – aaah, so we find out some more about you – you trained as a traffic engineer? Suddenly you’ve just gone down slightly in my estimation….
No, just kidding. Really. Honest. Almost…. Anyway – yes – deaths maketh the budget. If a few more school children would like to sacrifice themselves on the altar of highway bends, suddenly the road becomes all the more affordable…. of course, the reverse is harder to prove. If there are no accidents, and no deaths, then the road can stay unimproved.
Dismal science indeed – but it could be so much more exciting! Why not throw in a few more overbridges? A suspension bridge? Over the straights to Eastbourne or Pencarrow? or even from Centreport to Oriental Parade. That’d wake up the locals!
The Two Ronnies. LOL. Much like the NZTA proposals. One is dead and the other isn’t funny anymore.
It’s important to remember that no actual economists were harmed in the making of these economic models.
A few years ago I rang up the NZTA and asked how the costs and benefits were derived, and they helpfully sent me a copy of the Economic Evaluation Manual (EEM). It’s meant to be used to compare the benefits between different roading projects, but has been gradually bastardized over the years to providing the underlying economic justification for building roads.
Because of its origins, it pretty much ignores all the actual, measurable cost impacts of the roads and instead focuses on what are called “first order effects”. You may know these by their other name as “entirely fictional benefits”. There are some real pearlers buried in there, such as the fact that the benefits are based on subjective surveys of whether people think their time is more valuable depending on their mode of transport … which gives rise to the idea in the EEM that car drivers are more valuable than bus passengers, who are more valuable than cyclists, who are more valuable than the practically worthless pedestrians.
So the implication from the EEM is that if you make the mistake of walking to a business meeting, you will contribute practically no economic value to the country, whilst driving to the same meeting ups your economic contribution by a factor of about 10. No, that was not made up by a dyslexic ten year old after playing too many late-night sessions of Sim City, but is part of the actual model used to make transport decisions in this country.
And the sense of Alice-Through-The-Looking-Glass unreality that pervades the benefits side of the equation is also present on the cost side, where they presumably use unicorns and hippogriffs to do the research. One of the most obvious omissions is that the depreciation in house values that occurs in the properties next to your shiny new motorway is excluded from the cost calculation, although it’s the one thing that can be tangibly measured and reliably predicted.
When I asked the helpful man from the NZ Transport Agency why all the actual, measurable costs were excluded, he told me that if they were included it would be impossible to economically justify the roads they wanted to build!
It’s safe to conclude that the purpose of any economic “analysis” emanating from the NZ Transport Agency is to provide post-hoc rationalization for the decisions that have already been taken. So it’s difficult to take their assertions seriously when we are stuck with an economic methodology that makes small children point and laugh.
Ronnie (I have a sneaking suspicion that this might not be your real name) I would beg to differ
http://www.youtube.com/watch?v=kAG39jKi0lI
Lower strength rating today – terribly hungover
@Kent. If I remember back to when I was a pfy playing sim city till the wee hours it actually discouraged rabid road building. You build too many roads, eg making your grid too dense, and it would create traffic problems which your citizens would complain about. The solutions were not to make your block sizes too small and build transit systems. Of course it probably is different depending on the version. (what fun, need to upgrade laptop and download me a copy of cities xl now)
Thought it would have been 28MPa at most for a hangover?
An interesting little article in Unlimited, on Stephen Joyce, of which – I include a snippet below:
“Steven Joyce and much ado about nothing – The less you do, the more they like you.”
“Steven Joyce is not your average politician. He’s not lobby fodder, he’s not a seat warmer and he’s not a glad hander. You could stretch it a bit further and say he’s not really a politician.
He perpetually wears the smile of the father who won’t let you have a puppy. One day when we’re all grown up, we’ll understand. At the core of a ‘do-nothing’ government, Steven Joyce is the man who ensures they’re not doing it. Too harsh? Considering the immensity of the change New Zealand requires and the work his government has done so far, no.
There’s simply no way our economy will become prosperous without spending much more on research and development and this government’s support for it has been meagre. There’s no way to avoid a future without fossil fuels. This government continues to build what Joyce identified as highways of national significance.
And there’s no denying that school class numbers are too high and with teacher pay so low the calibre of teachers is not what it ought to be. This government’s National Standards exercise will merely confirm that fact.
We remain on course for a dwindling future, selling cheese to the world, flipping burgers and opening hotel doors. Meanwhile, we live on borrowed money and pretend we are a prosperous, sophisticated little powerhouse of a nation.
Why on earth would so many of us embrace such a meagre prescription? Here we find the genius of Steven Joyce, election strategist. ‘Give them more of what they know!’ It worked when he was in the radio business, it worked in their election campaigns and it’s working for them in government. People like roads, so build them more roads…..”
for the rest of the story, and it’s a cracker by David Slack:
http://unlimited.co.nz/unlimited.nsf/life/steven-joyce-and-much-ado-about-nothing